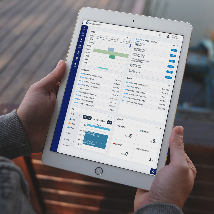
SAP Workload Monitor
When using the SAP System at headquarters or in individual subsidiaries, the SAP Workload Monitor (T-code ST03) is used to check the performance of the SAP System, including CPU time, response time, etc.
Details you can check:
You can check the workload for task types such as Dialog (where regular users view programs), Background, RFC, and ALE.
Average CPU Time is the time a SAP work process queries the CPU from the operating system at the final step of the transaction. It includes CPU loading of work processes, database request processing, ABAP processing, etc.
Average Response Time is the time it takes for the dispatcher work process to send a request during a dialog process and for the data to be sent to the presentation layer.
Response Time = Waiting Time + Execution Time
Execution Time consists of:
- Program, screen, GUI load time
- Roll times for rolling in the work data
- ABAP processing time
- Database time
- Enqueue time for logical SAP lock processes
- CPIC/RFC time
- Roll wait time
Depending on the location of the SAP server (whether it’s on-demand or hosted in AWS in the Asia-Pacific, Europe, US, etc.), there can be slight differences in SAP GUI Time (the time taken between the AP Server and the frontend user PC) for headquarters and different subsidiaries.

In ST03, if you go to the left-side Menu Entry, you can analyze the monthly workload.
The Dialog section reflects the average response time for users.
For example, if the Average Response Time is 0.787 seconds, with GUI Time accounting for 0.263 seconds, approximately 34% of the total response time is attributed to GUI Time (which is influenced by network or PC performance).
Each subsidiary can run the SAP System, check these times, and determine which areas may need improvement.
'IT' 카테고리의 다른 글
| SAP Material Master Valuation class (1) | 2022.09.29 |
|---|---|
| Material Movement in Quality Management (0) | 2022.09.27 |
| International Dedicated Line (0) | 2022.09.26 |
| 네트워크 구성도 (1) | 2022.09.26 |
| Microsoft Intune (0) | 2022.09.26 |


